

According to the Department of Foreign Affairs and Trade, Australia exported a combined $104 billion in iron ore, coal & concentrates throughout 20161, closely followed by education-related travel services, gold, natural gas and beef. All this ranked Australia 19th for both imports and exports in the world, valued at approximately 210 billion US dollars. While it’s not one of the biggest exporters, with China topping the list, followed by the US, Germany, The United Kingdom and Hong Kong, these countries also proved to be Australia’s top export partners - China (21.81%), Japan (19.19%), South Korea (7.88%), India (7.51%), US (4.95%), UK (4.37%), NZ (4.1%)2.
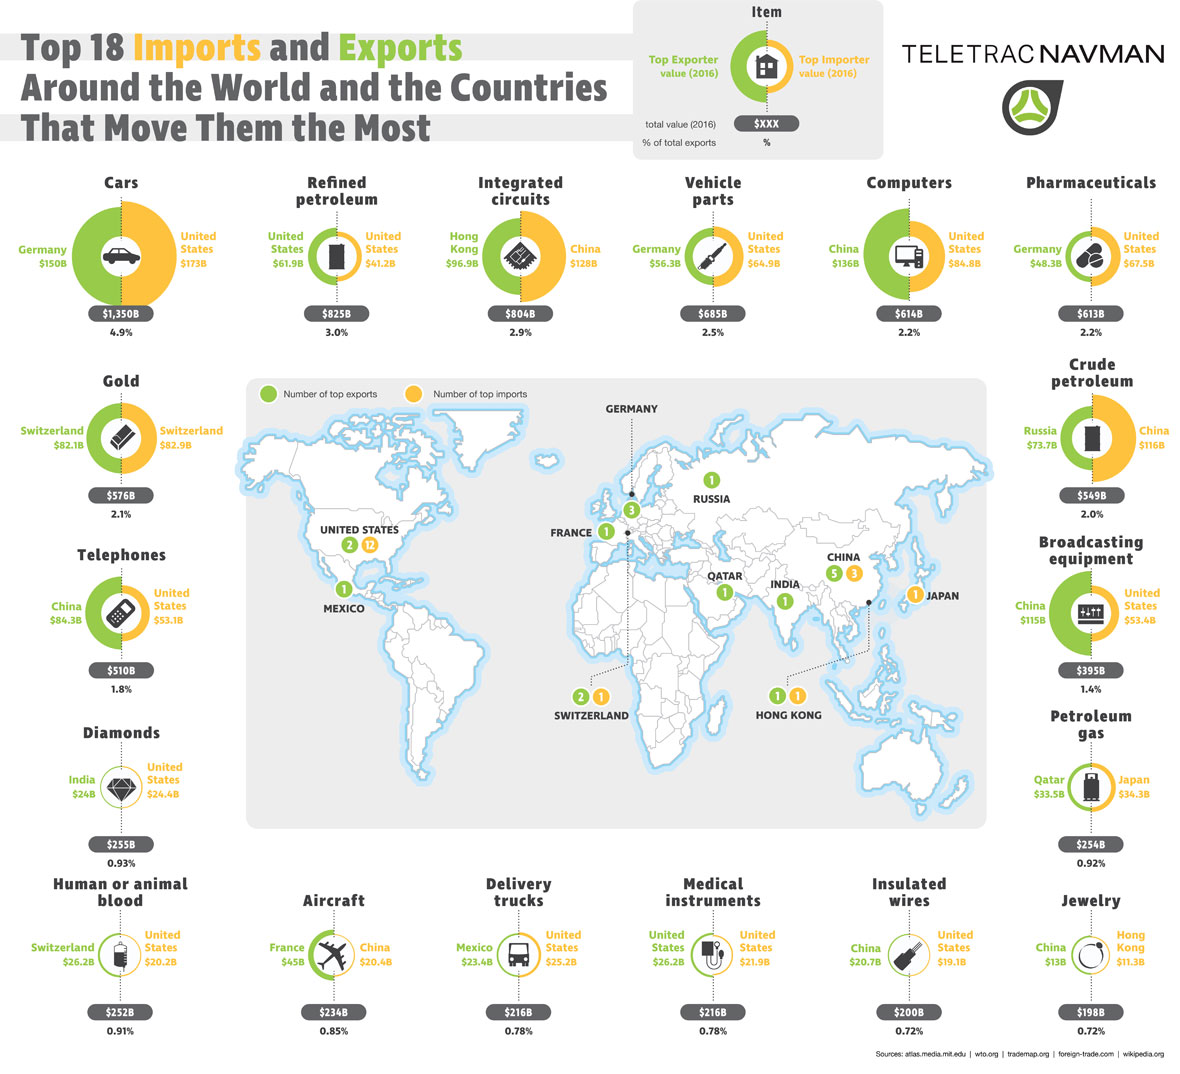
While the Observatory of Economic Complexity at the Massachusetts Institute of Technology records US based statistics, it also maintains a complete list of countries by imports and exports around the world. After analysing this data, we determined the top 18 imports and exports around the world by percent of total exports and the countries that move them the most.
What is the most exported product in the world?
Not surprisingly, cars are the most imported and exported product in the world by value. In 2016, the top exporter was Germany which exported $150 Billion in cars. The top importer was the United States which imported $173 Billion in cars.
Worlds Top Export Products 2016
Here are the top 10 exported products in the world in 2016 by total value shipped worldwide in 2016.
1. Cars ($1,350B)
2. Refined Petroleum ($825B)
3. Integrated Circuits ($804B)
4. Vehicle Parts ($685B)
5. Computers ($614B)
6. Pharmaceuticals ($613B)
7. Gold ($576B)
8. Crude Petroleum ($549B)
9. Telephones($510B)
10. Broadcasting Equipment ($395B)
Sources:
1 Australia’s trade at a glance, March 2017. Australian Government – Department of Foreign Affairs and Trade
http://dfat.gov.au/trade/resources/trade-at-a-glance/pages/top-goods-services.aspx
2 Australia Exports, Imports & Trade, March 9 2010. Economy Watch
http://www.economywatch.com/world_economy/australia/export-import.html