
Driver behaviour monitoring system
Why businesses are investing in fleet data
Data has many meanings. Gone are the days of 'dot on the map' tracking capabilities that any gps-enabled device can supply. The requirements of each business differ greatly, and as times have changed, the needs have also evolved. The sophistication of data has expanded to deliver the real financial costs of a vehicle and driver on the road.
Build Your Solution Explore our Platform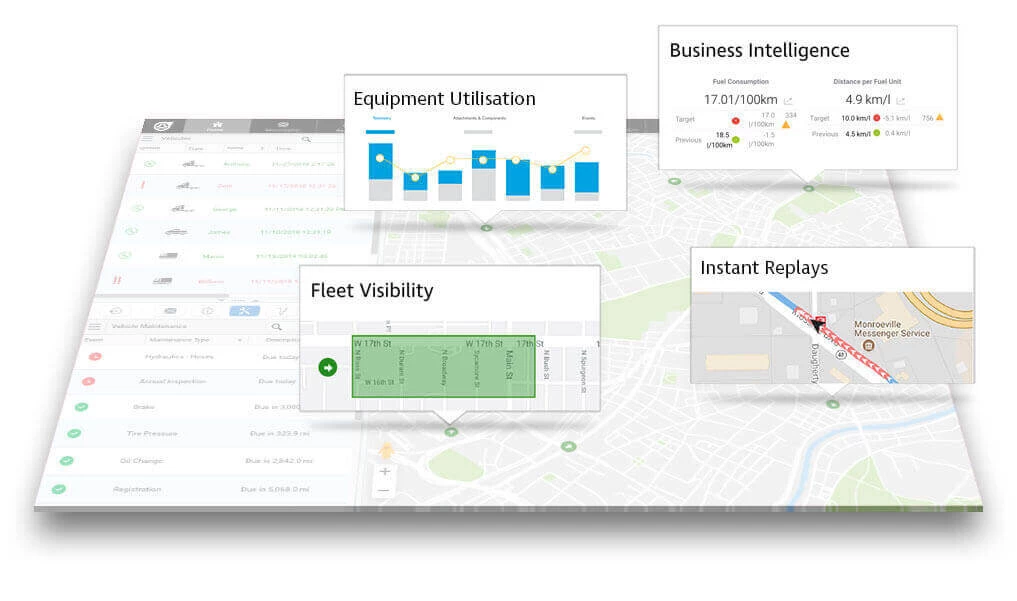
The Technology of Driver Behaviour Monitoring
What Driver Behaviour Monitoring Systems can do
In today's modern world, progression in technology can now provide you with critical analytics around driver behaviour and how it directly impacts company benchmarks such as safety, fuel use, harsh usage, and vehicle maintenance costs.
The right system will utilise the data provided by telematics to help a fleet manager identify the areas of opportunity, whether it’s revenue, customer satisfaction or federal compliance, and deliver that information to motivate daily business decisions.
Vehicle and driver behaviour data helps the business to automatically record daily activity without physically reaching inside the hood of a vehicle to extract information or waiting for the driver to return. This data offers a powerful look into the health of the business through customised dashboards and analytics. This type of deep data helps to steer a company’s focus towards things like trends that help to analyse issues that previously weren't uncoverable, like excessive time spent on site, inefficient routing, and more. In-depth data leads to more informed business decisions that can impact a company’s financial success.
The versatility of the data within driver behaviour monitoring tools helps to track and monitor fuel waste and related costs, distances travelled, idle time including power take-off (PTO) time, and driving habits, for single vehicles, sub-group or an entire fleet. GPS tracking software provide a full view of this fleet performance data, including the lowest and highest ranking vehicles for each of the metrics, giving users a handful of productivity, diagnostics and maintenance data.
Overall, actionable vehicle data can benefit multi-fleet national operations right through to the smallest of businesses with a handful of vehicles. While GPS data can give you peace of mind when you want to ask “Where are my vehicles?”, using comprehensive fleet data as part of everyday fleet management can help cut down fuel consumption and other inefficiencies, increasing a fleet’s lifespan, productivity levels, and cost savings.
Improve Driver Safety
Discover how our solutions can help you promote safe driving habits, reduce accidents and protect your drivers.
The cumulative number of kilometres a driver has accrued for a specific time period
Amount of fuel used by a driver, which can be impacted by harsh driving, idle time and unnecessary stops
 Idle Time
The total time a vehicle’s engine is running when the vehicle is not in motion
Real-time odometer and engine hour information to help keep up with maintenance schedules for a safe fleet
The number of stops a driver takes while on the clock, including en route to a customer or site
The ability to see vehicle activity and daily usage to optimise efficiencies and improve the business's productivity
The total time a driver spends delivering and completing a task at a site or customer
The total time, length and number of breaks that a driver takes on the road each day
Monitor the data that matters
What is Driver Behaviour Data?
Good driving habits can save a company from disaster. A quick mistake on the road can negatively affect the business, from driver injuries and liability costs to loss of contracts through poor reputation.
While the direct costs of crashes, such as vehicle repair and insurance payments can be calculated with relative ease, the indirect costs are severe. Suffering business loss, litigation expenses, loss of productivity due to incident analysis from enforcement, can ensure the company suffers for years to come.
Safety data provides fleet managers with the eyes and ears to be a backseat driver without stepping foot into a vehicle. Managers can assess the strongest and weakest drivers in their fleet by consistently monitoring the safety behavior of their employees on the road.
In fact, a recent Teletrac Navman study* concluded that 40% of drivers change their behaviour after their first safety warning.
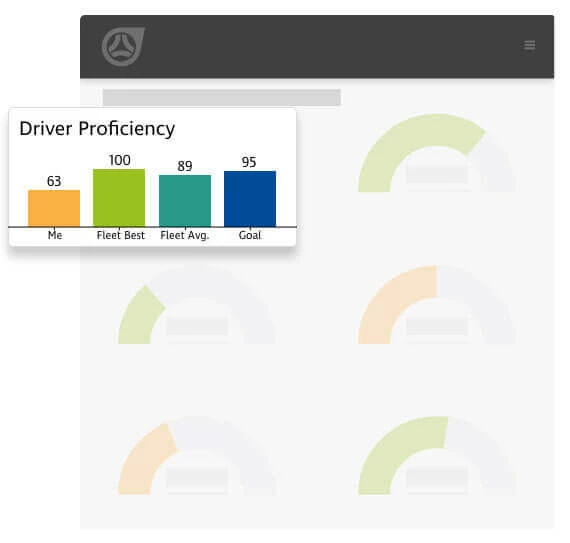
The driver safety solutions arm managers with the ability to view safety data on demand. They can quickly measure a fleet’s safety average through the score indicator based on safety parameters, including harsh braking, harsh acceleration, speeding and stop sign violations.
This is furthered by the ability to see the top 10 worst and best drivers in a fleet—including an individual driver safety score— allowing managers to monitor safety performance across their drivers.
Driver Behaviour Monitoring
What Does Driver Behaviour Data Measure?
Speeding for each vehicle is determined by matching GPS data to a map database which contains speed limit information. GPS speed is then compared to actual speed limits while the length of each vehicle infraction is recorded.

GPS data is used to determine which streets a vehicle has travelled. The data is then matched with a map database to determine the location of each violation.

The number of heavy braking incidents based on G-Force and the type of vehicle (light, medium or heavy).

The number of acceleration incidents based on G-Force and the type of vehicle. Harsh acceleration can cause unnecessary wear and tear on the vehicle and can pose a safety hazard to the driver and other vehicles
The number of forceful or quick cornering incidents that are identified for each driver or time period.
Easily see your fleet safety data
Driver Behaviour Monitoring System
The power to monitor vehicle and driver behavior allows businesses to have a strong competitive advantage. Teletrac Navman’s fleet management platform goes beyond location tracking to offer businesses measurable data that provides a snapshot of daily vehicle and driver activity. Having access to accurate behavioural data— such as fuel use, productivity levels, and safety patterns—allows companies to stay efficient, productive and cost-effective.
Driver Safety
Our fleet management system empowers users to receive insight into vehicle safety based on key performance metrics and recorded events, such as speeding and harsh braking. The results, including a measurable safety score, are showcased on data-rich dashboards.
This advanced feature pinpoints safety violations and inefficiencies—such as worst safety rankings and more— for an entire fleet or a single vehicle. Managers can use this effective option to prevent vehicle abuse and monitor unsafe driving behaviour.
Dashboards
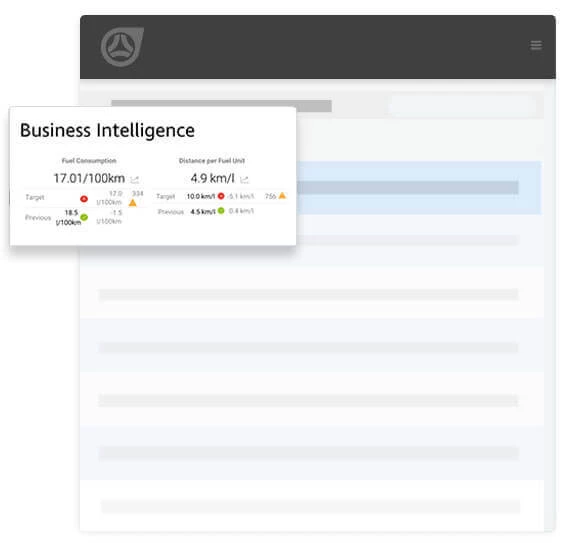
The Dashboards feature enables users to get a remote look at important vehicle performance metrics to best measure key inefficiencies across a fleet—right from their desktops or mobile devices.
This flexible analytics tool features data-rich, color-coded dashboards that showcase selected trip data for single vehicles, sub-groups, or an entire fleet. Users can drill down in to any of the metrics for a magnified look at engine performance, including: vehicle usage and kilometres driven, travel time, idle time, PTO time, fuel consumption and the total fuel cost accrued during a particular journey. The best and worst vehicle rankings are clearly displayed to indicate which vehicles within the fleet are the most productive during the workday.
Reporting
Vehicle and driver behaviour software provides a clean snapshot of metrics related to fleet performance, including a close look at fuel consumption and costs, idle time, travel trends and safety activity. Available reports include:
- Distance Driven
- Executive Summary
- Time Sheet
- Maintenance
- Driver Stops